
@ University of Toronto
I worked with a synthetic dataset of over 8,000 airline reviews to explore how different service factors affect passengers’ overall satisfaction. For the purpose of this course project, I took on the role of Emirates to answer three key questions:
- How has Emirates’ customer satisfaction changed from 2016 to 2024?
- How does Emirates compare to other major airlines in service performance?
- What service factors (if any) most influence Emirates’ overall passenger satisfaction?
This assignment was written for a graduate data science course at the University of Toronto.
📊 Dataset
I used passenger review data from a synthetic dataset (provided by the course instructor) simulating 8,100 flight reviews from 2016 to 2024 across 11 airlines.
For each review, the dataset contained information on:
- the airline flown (e.g. Emirates),
- the flight route (e.g. Brisbane to Dubai),
- and the class of service (e.g. Economy, Business, etc.)
Each review also contained individual passenger ratings on 5 service factors in a 1-5 scale: seat comfort, food and beverages, staff service, inflight entertainment, and value for money. An overall satisfaction score on a 1–10 scale was also included.
In addition to quantitative fields, the dataset contains metadata such as review title, reviewer’s name, review date, and month flown, etc. These fields were not used directly in the statistical modelling.
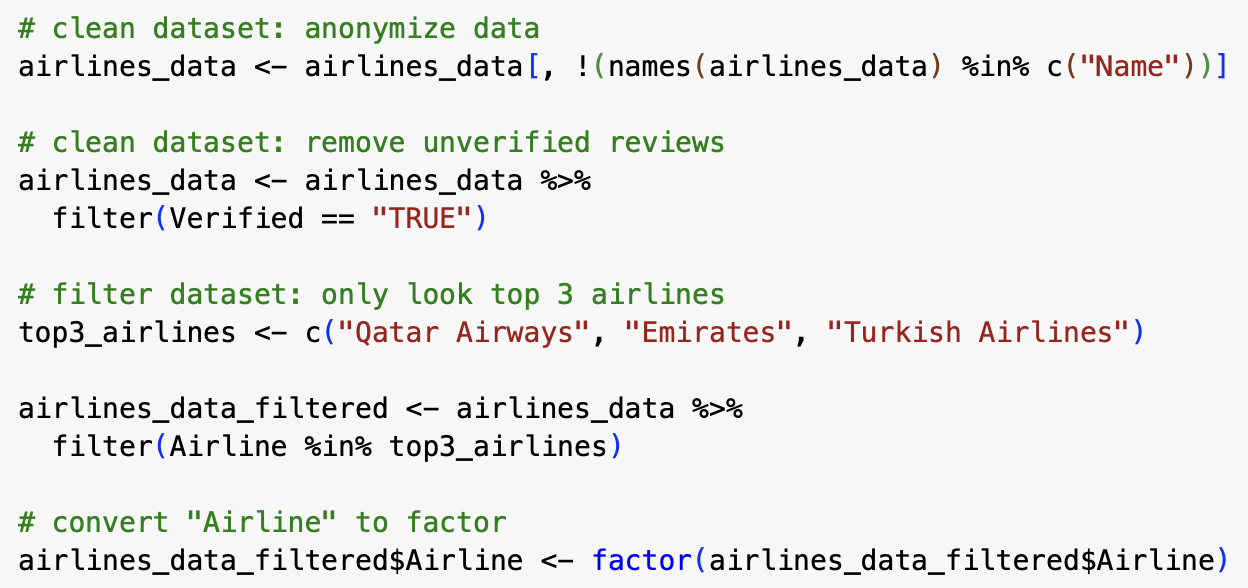
Data Preparation
Categorical fields (e.g. airline) were converted from strings into factors. Reviews that were unverified were removed. Irrelevant columns were removed (e.g. the “name” column was removed to anonymize reviews).
🛠 Libraries Used
I used R for data cleaning, analysis, and modelling. Main libraries used include:
dplyr– used for data manipulation tasks such as filtering, grouping, summarizing, and mutating columns in a clean, readable syntax.ggplot2– used to create clear and customizable visualizations.tidyr– used for reshaping data to ensure it is in a tidy format suitable for analysis.
Data Analysis
Exploratory Analysis
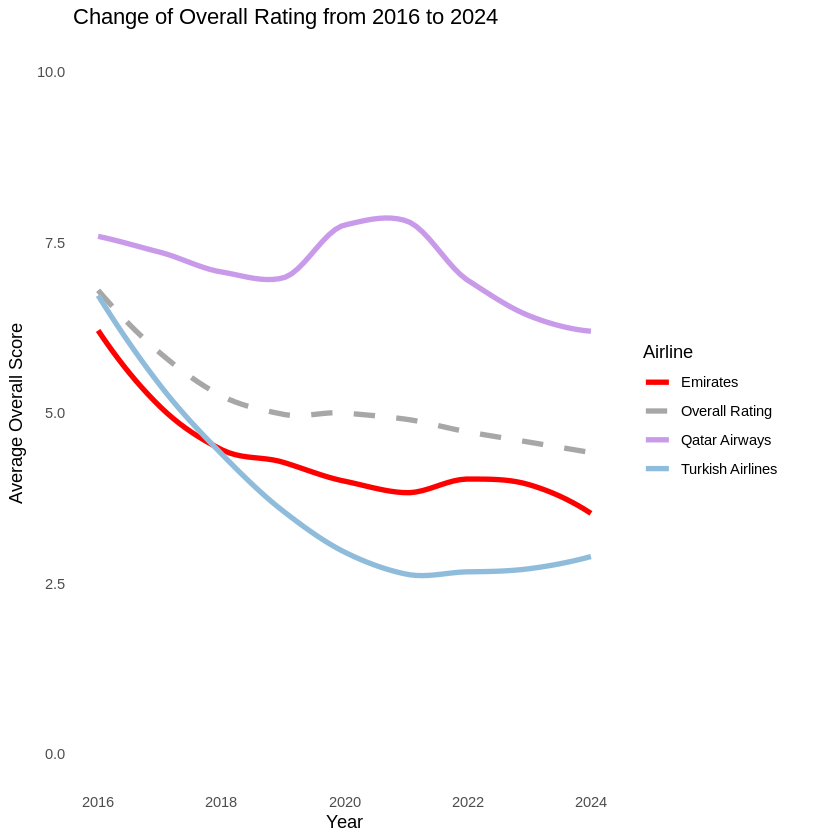
While the dataset contained 11 airlines, for the purpose of the project scenario, this analysis compares Emirates against Qatar Airways and Turkish Airlines. Initial analysis (Figure 1) showed that the overall average customer satisfaction rating has declined since 2016. Specifically, Emirates’ overall average rating falls below that of Qatar Airways and is slightly above that of Turkish Airways.
Multivariate Analysis of Variance (MANOVA)
To figure out the reason behind this decline, I wanted to first know whether airline choice significantly affects how passengers rate these services.
I performed Multivariate ANOVA and analyzed customer satisfaction data across the three major airlines. Specifically, I looked at the 5 key service areas: Inflight Entertainment, Staff Service, Value For Money, Seat Comfort and Food & Beverages.
I ran MANOVA first instead of running multiple ANOVAs because MANOVA allowed me to test for differences in all five service ratings at the same time, while also considering how those ratings might be related to one another. MANOVA checks whether the combination of service ratings differs significantly based on the airline. Instead of analyzing each rating in isolation, I wanted to look at the big picture first: how passengers evaluate the entire flight experience.
Results: The test produced a p-value of less than 0.01 which means there is strong evidence that at least one airline differs in its average ratings across the five service factors. The test showed that approximately 40% of the variation in service ratings can be statistically linked to which airline a passenger flew with.
Univariate Analysis of Variance (ANOVA)
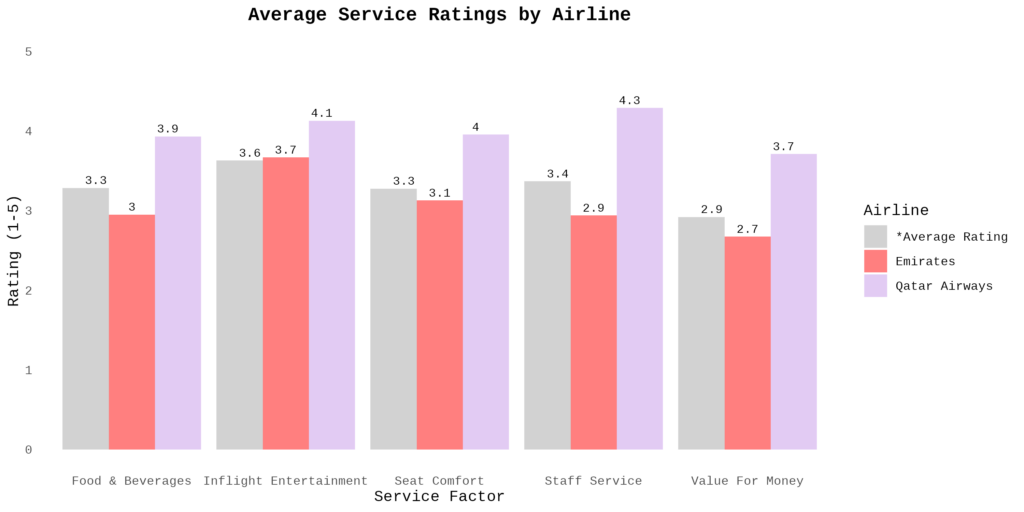
The limitation of MANOVA is that it does not know which specific variables differ and in which direction. Thus, I performed follow-up univariate ANOVAs and post-hoc tests using Tukey’s HSD (Honestly Significant Difference) which showed that all factors varied significantly across airlines (Figure 2).
Results: While Emirates is performing better than Turkish Airlines, Emirates is performing significantly below Qatar Airways in all service factors.
Linear Regression
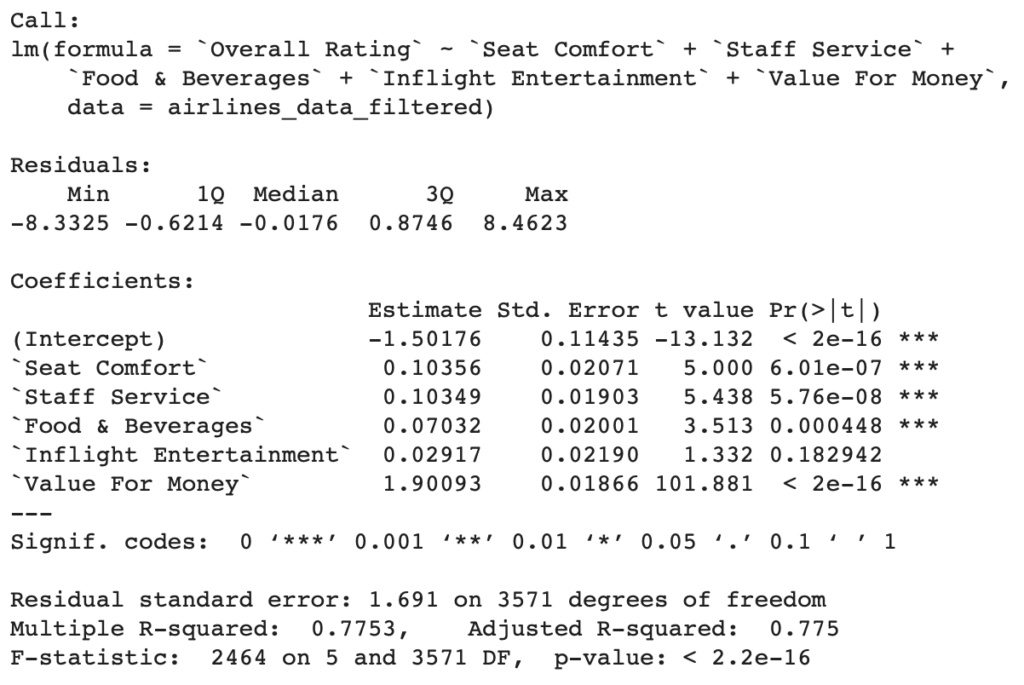
Finally, I used linear regression (Figure 3) to measure how each service factor (predictor variable) influences overall customer satisfaction (response variable). This helped identify which service factors have the strongest impact on overall customer satisfaction.
Key Insights
To summarize the R code output:
- Value for Money is the most influential factor in how passengers rate airlines,
- Inflight Entertainment does not significantly predict overall rating (p-value = 0.18),
- ~78% of the variation in Overall Rating is explained by these five variables.
The main interpretation from the linear regression is that all service factors have a positive relationship with overall satisfaction where steeper slopes (i.e. coefficients) indicate a stronger influence.
Summary
Approach
Multivariate Analysis (MANOVA): Tested whether there were significant differences in the combined set of service ratings across airlines.
ANOVA & Post-Hoc Tests: Explored individual service factors to identify where differences were most pronounced.
Linear Regression: Modelled how each service factor predicts the overall rating to understand the relative impact on passenger satisfaction.
Key Findings
MANOVA results showed that airline choice explains ~40% of the variation in combined service rating factor.
ANOVA results showed that Emirates is scoring lower than competitors in areas like value for money.
Regression model showed that seat comfort and staff service are significant positive predictors of overall satisfaction, but no single factor fully explains overall rating.